TVPR: Generalized Tobler Hiking Function R update
Introduction
Last year I finally got around to documenting the generalized version of Waldo Tobler’s hiking function that I use for personal and professional projects, including a predictive model I am still working on. In that post I go into more detail about the history of the function, and detail the math involved. Included was a version of the equation in a form useable with Whitebox Workflows (WbW) plugin raster calculator for QGIS, which was my preferred methodology. In the meantime, QGIS has updated to the 4.0 branch, bringing a much needed refresh to the QT6 library – and breaking many plugins in the process. Unfortunately this includes WbW, at least for now¹, so I had to find a new methodology. This led me to the terra package in R.
Tobler Velocity Percent in R (TVPR)
Tobler’s original function was presented in a simple pseudo-code:
W = 6 exp (-3.5 * abs(S + 0.05))
where W is walking velocity; and S is slope in form “rise over run”, or tan($\theta$), where $\theta$ is slope angle in degrees.
In more usual mathematical notation:
\[v_p = \frac{6 \times e^{-3.5 \times |m + 0.05|}}{6 \times e^{-3.5 \times |0 + 0.05|}}\]Note that we are using $v_p$ for “percent velocity”, $m$ for slope. Equation $5a$ from my previous post gave the generalized version for grade slopes (e.g. $\frac{dy}{dx}$ or $\frac{\% slope}{100}$):
\[(5a) : v_p = \frac{e^{-|3.5m + 0.175|}}{e^{-0.175}},\]and for slopes in degrees:
\[(5b) : v_p = \frac{e^{-|3.5 tan \theta + 0.175|}}{e^{-0.175}}.\]Converting degrees to radians, Equation $5e$ is what we need to use with R, which expects radians:
\((5e) :\) vp = exp(-1 * abs(3.5 * tan(deg / 360 * 2 * pi) + 0.175)) / exp(-0.175)
This form is pretty much exactly what we need to use in R:
# Load required libraries
#require(tidyverse) # not needed, but useful to load if other expoloratory analyses are desired
require(terra)

# Import degree slope map
dsm <- rast("/path/to/map.tif")

# Calculate TVP
TVP <- exp(-1 * abs(3.5 * tan(dsm / 360 * 2 * pi) + 0.175)) / exp(-0.175)

# Write output
# not run
# writeRaster(TVP, "path/to/output.tif")
Results
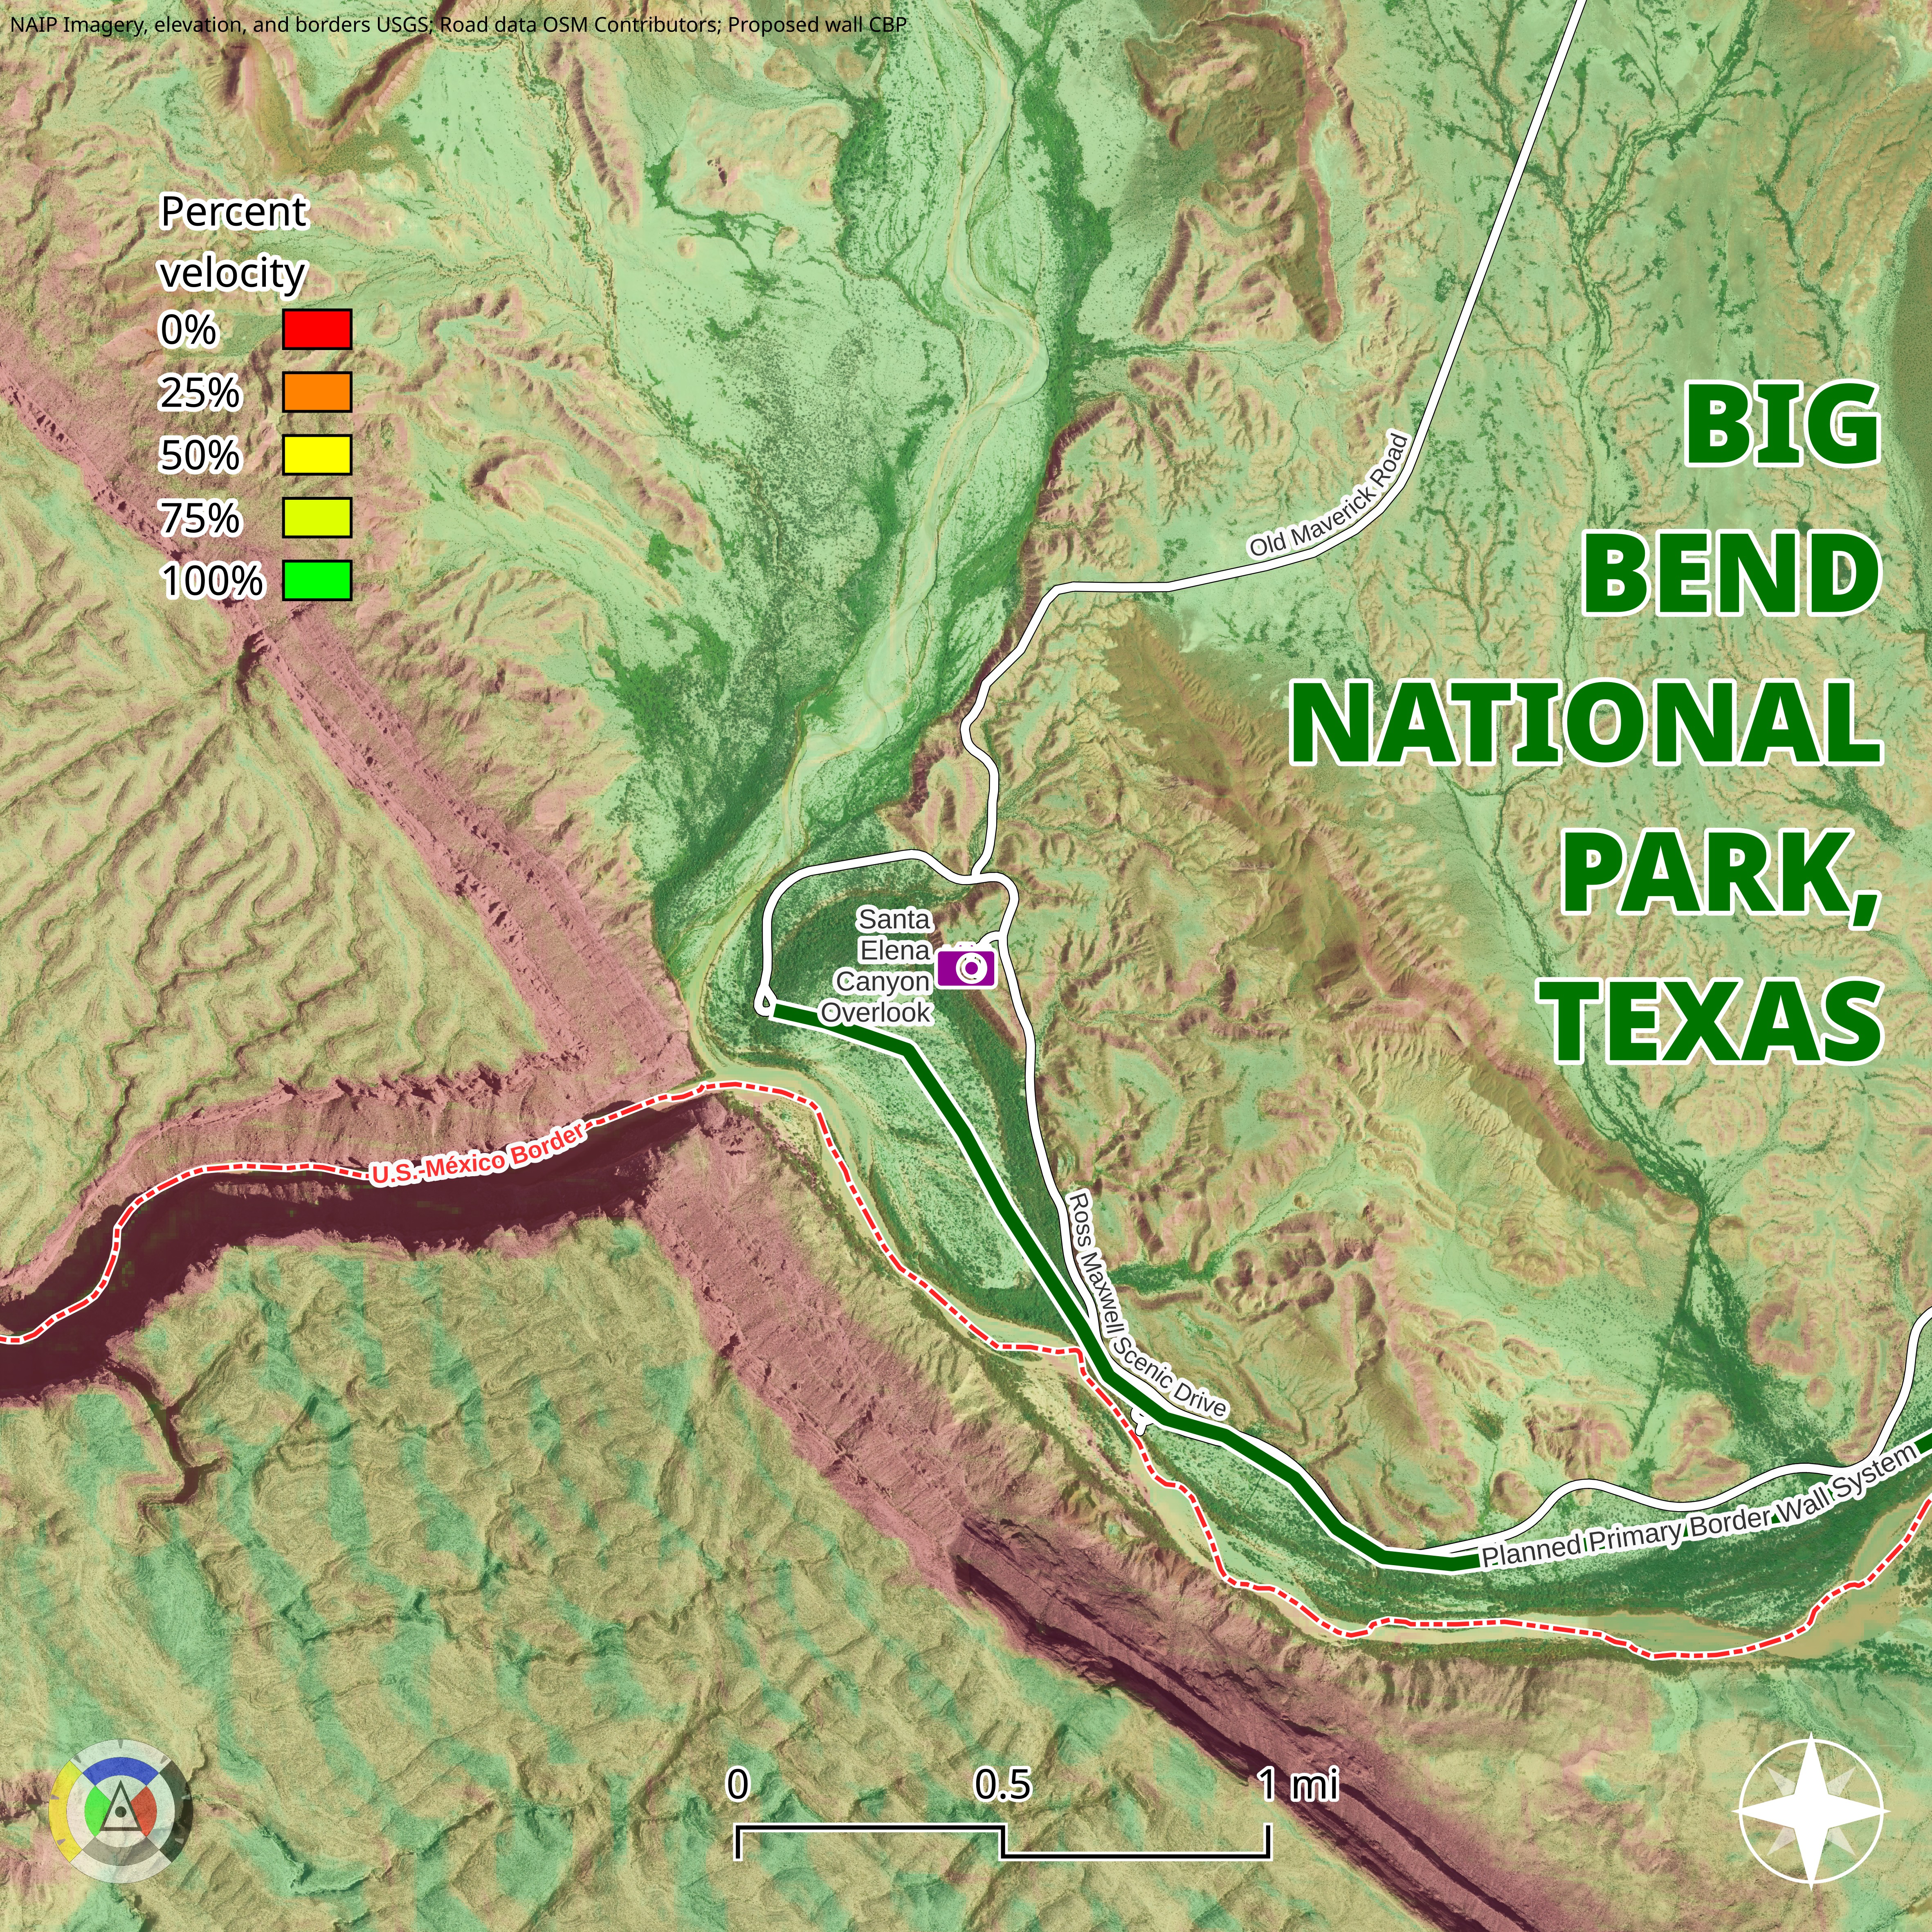
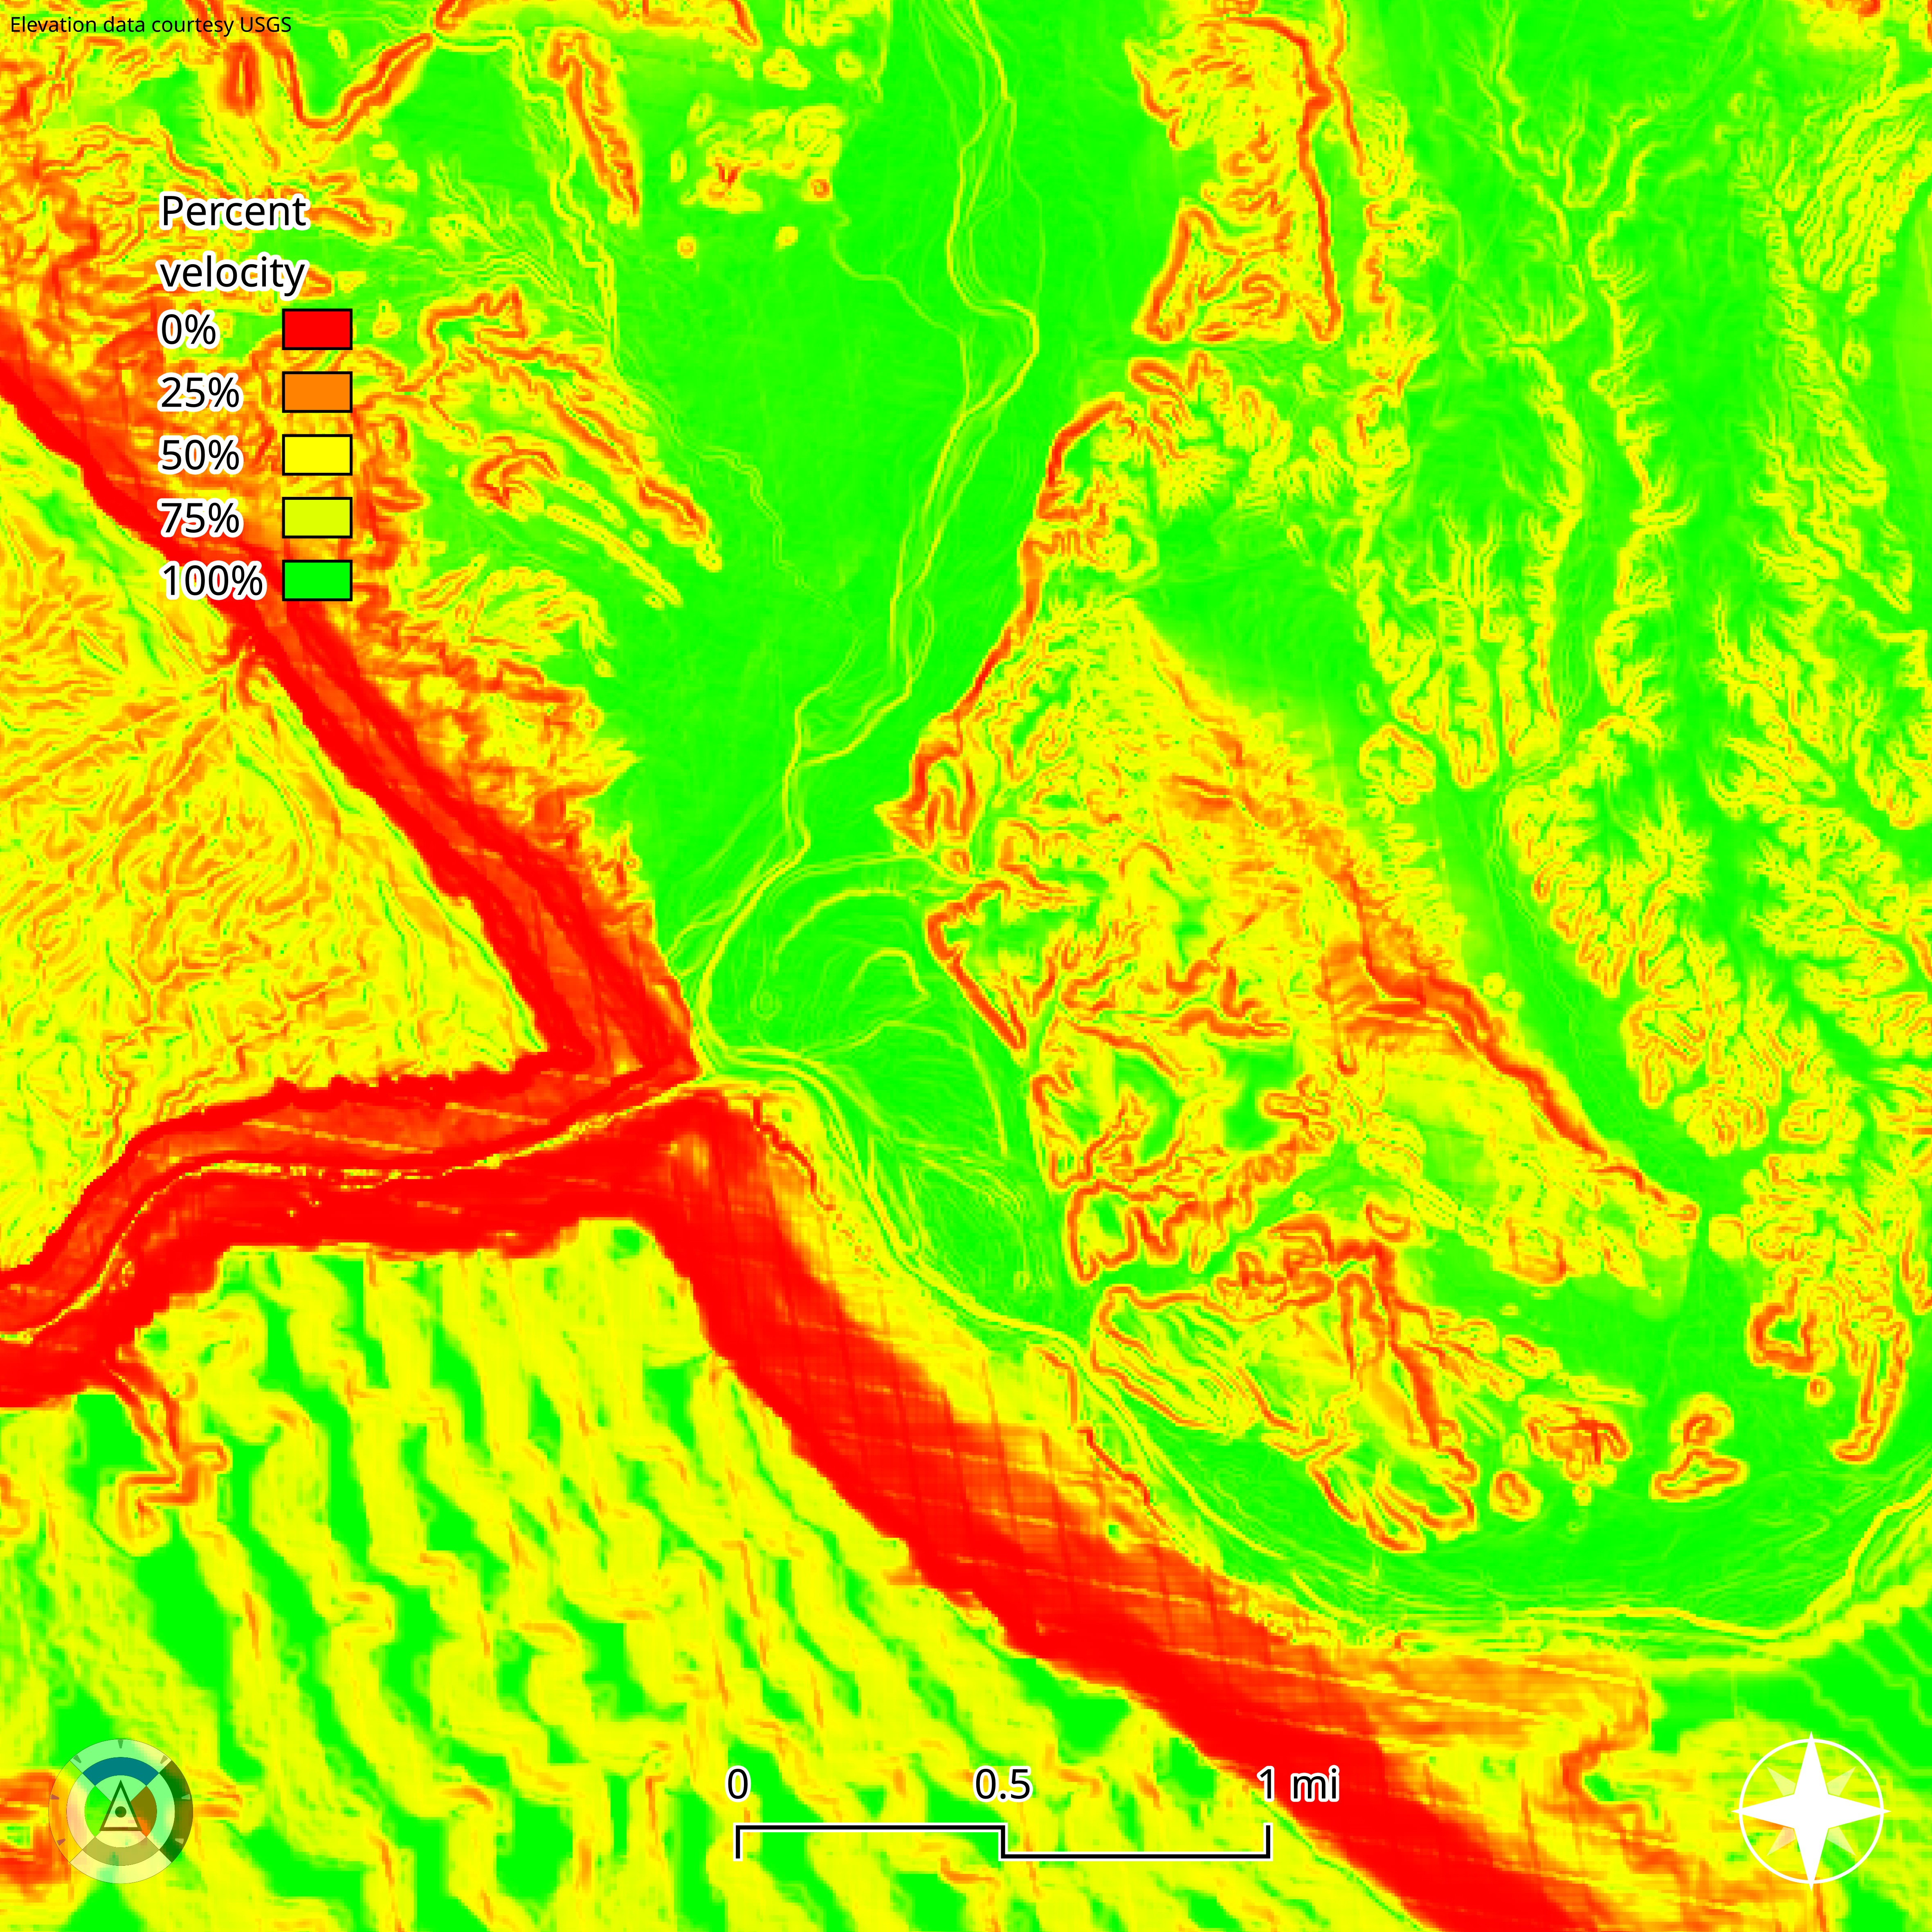
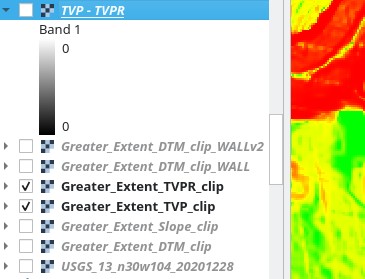
I thought there was potential for differences in implementation to make the output from WbW (TVP) and R (TVPR) slightly different, so I did a test using a map I had made of the Santa Elena Canyon area in Big Bend National Park. I originally made the map as part of an exploration of viewshed and terrain to show the absurdity of the new border wall planned for the area². Comparing the older TVP I had made with WbW to the TVPR, however, there were no detectable differences to the eye, and differencing the two maps lead to a map of all 0s. No differences up to the limits of accuracy on my computer. It makes the visuals a bit boring, but is a very encouraging result for simply using this methodology as a drop-in replacement for WbW.
¹The plugin author appears to be re-writing everything in rust, but no info on when this will be finished was found at the time of publication, and no version of WbW is available in QGIS4 at this time.
²Some time after I made that map, the planned wall has been changed to "detection technology only" and new patrol roads, in response to public pushback.
NB page updated 2026-05-09 for minor spelling/style corrections, and updates to code.